Web Interface
The web interface allows the user to simulate and analyze the evolution of (multiple) stellar populations.
The the amounts of elements
and isotopes ejected is provied via yield tables and can be dowloaded.
Go to the public NuGrid WENDI server here, then into the SYGMA directory and click on the Jupyter notebook SYGMA self-guided user interface.ipynb.
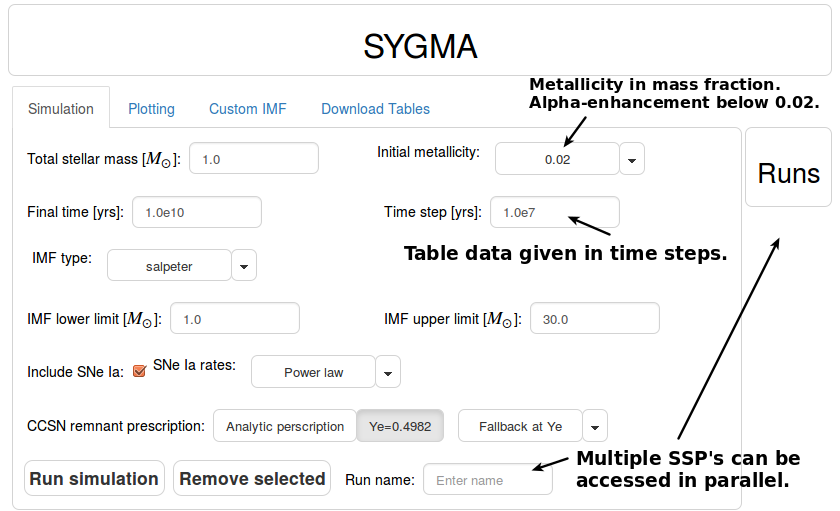
Input parameter
Each simulation can be run with a particular set of input parameter as show in the following figure:

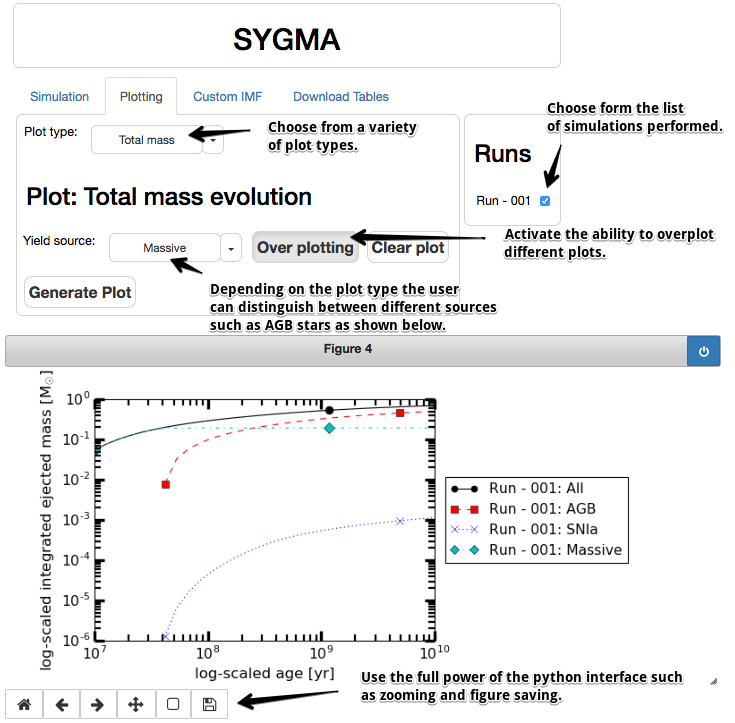
Plotting capability
The user can analyze the results via a variety of plots:

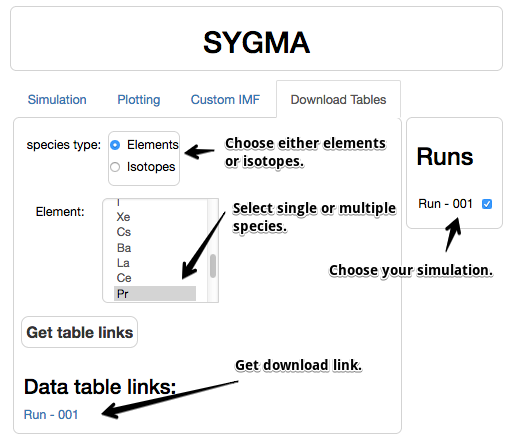
Table download
To download tables with the amounts of ejecta of simple stellar populations, use the following window:
